
Black Friday answers one question: how did a store trade during a major promotion? For a Shopify brand that spends on advertising throughout the year, the ordinary trading weeks matter too. Here are three reports from one store we supported with Paid Ads and Klaviyo. All figures are in USD.
January: store sales rose 60% year on year
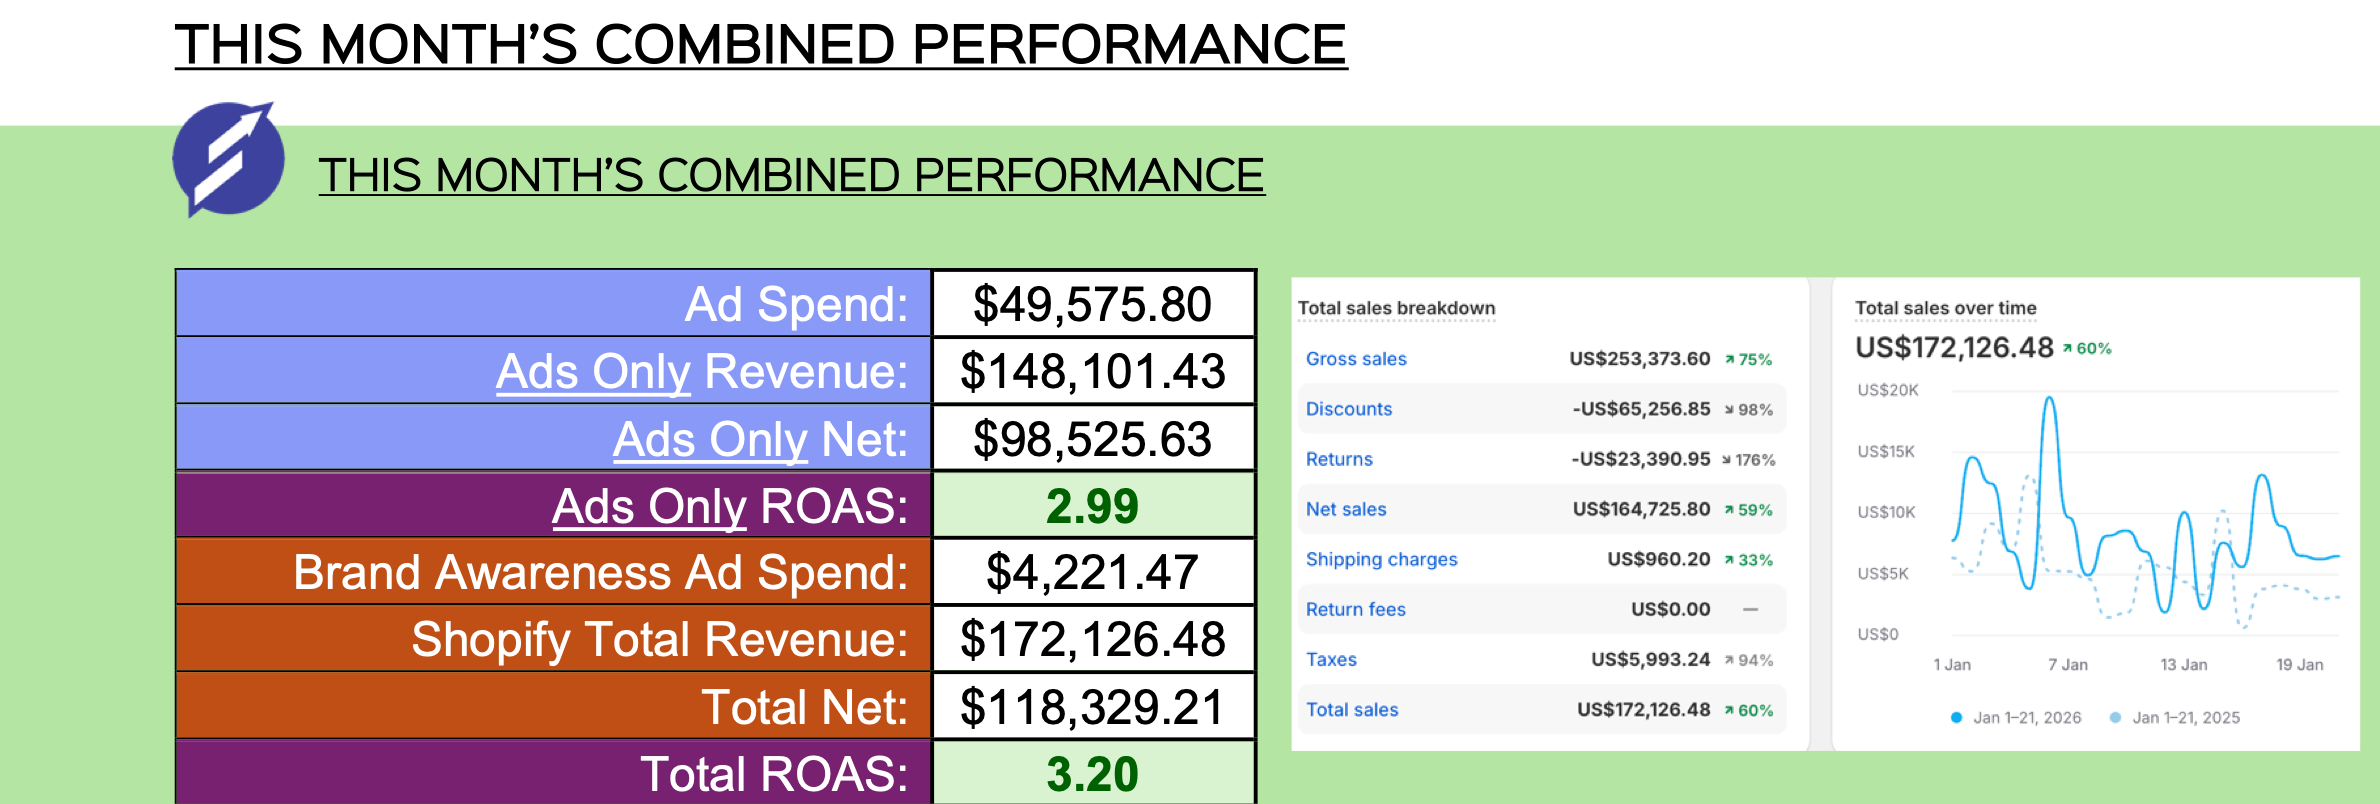
Shopify recorded $172,126.48 in sales from 1 to 21 January 2026, up 60% against the same dates in 2025. The accompanying report recorded $148,101.43 in revenue attributed to paid ads. Shopify counts orders across the store. The attributed figure is the advertising report’s view of sales credited to ads. Adding the two together would count sales twice.
May: $223,464.87 in ad-attributed revenue
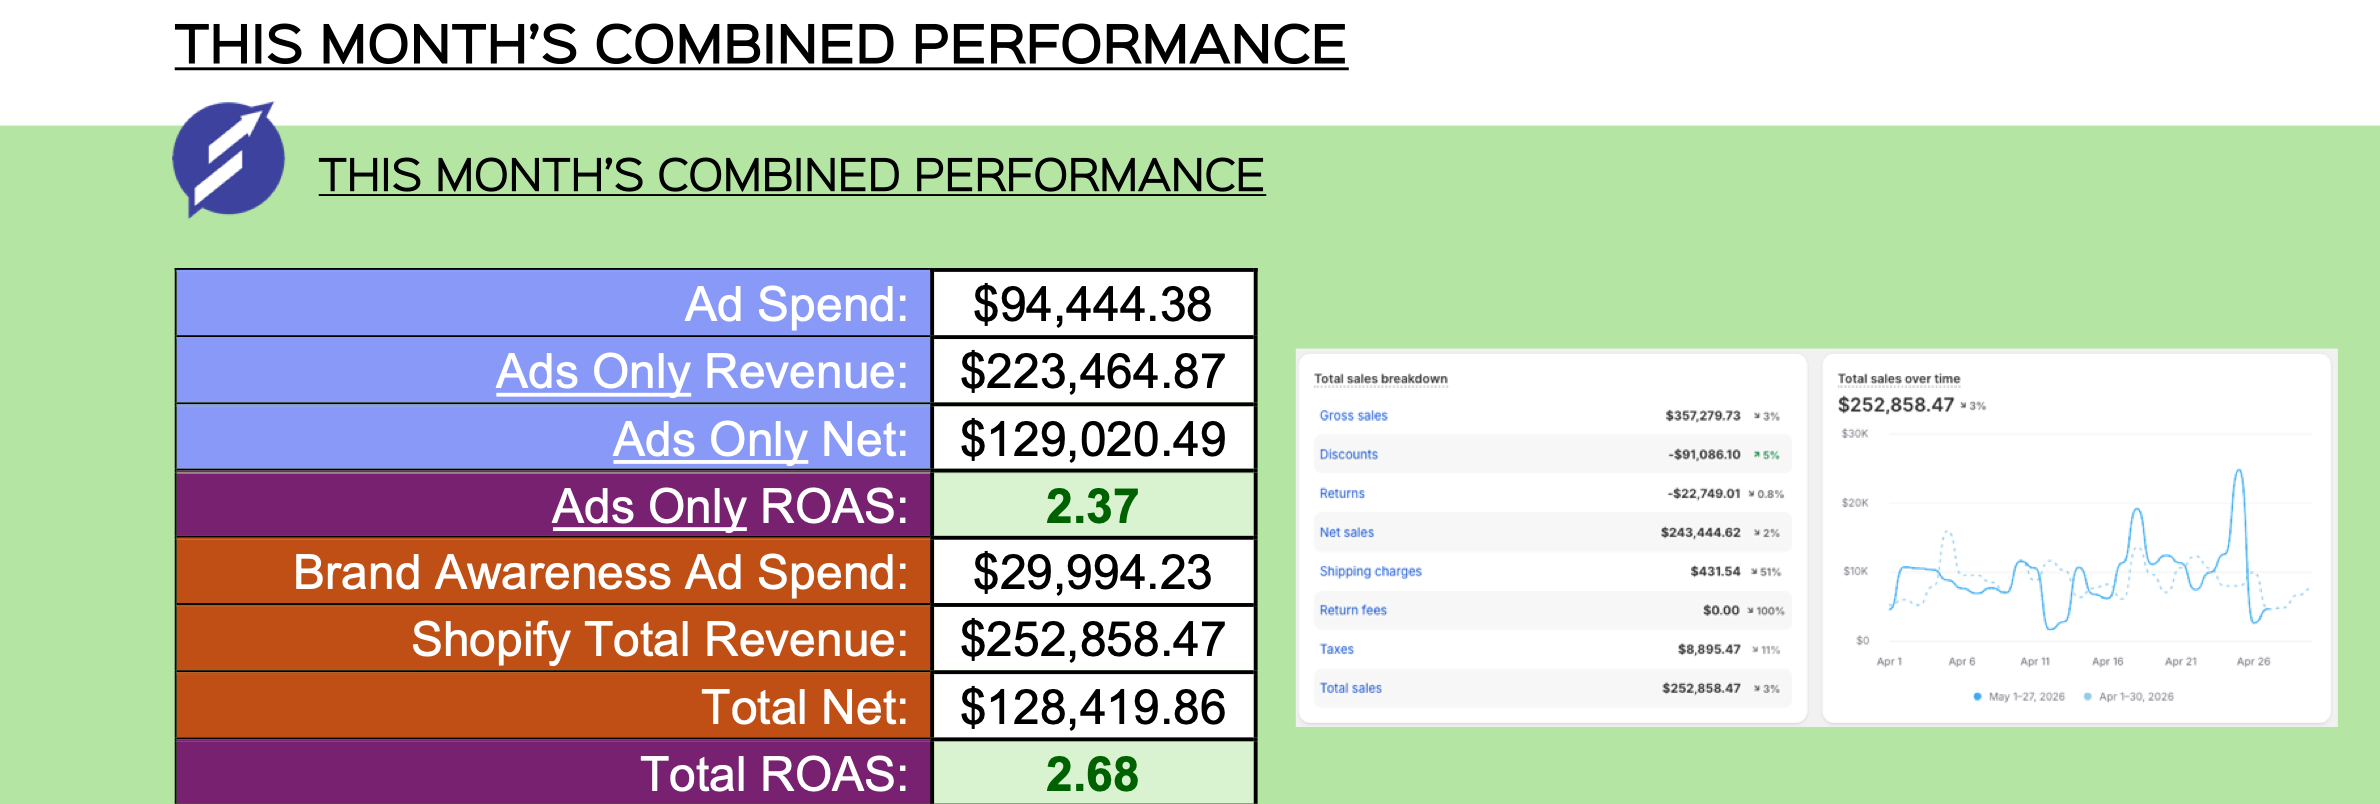
The May report pairs $223,464.87 in ad-attributed revenue with $94,444.38 in ad spend. It lists a further $29,994.23 for brand awareness separately. That distinction matters when comparing return on ad spend: the report’s displayed ratios exclude the awareness budget. The Shopify panel records $252,858.47 in store sales from 1 to 27 May.
June: $313,827.28 in Shopify sales in 26 days
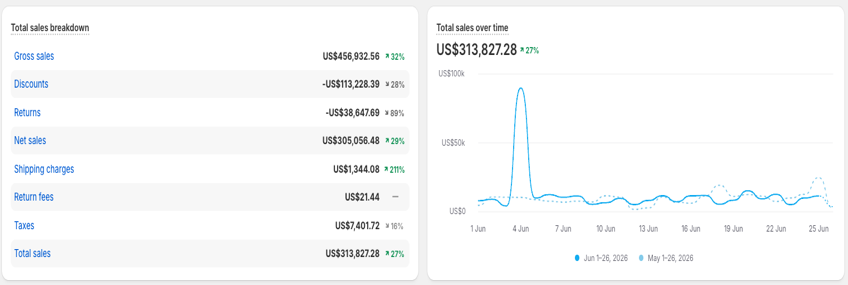
The store recorded $313,827.28 in Shopify sales from 1 to 26 June. Shopify shows this as 27% higher than 1 to 26 May. This comparison uses matching dates. The separate May report above includes an extra day and should not be used to recalculate the percentage.
What a store owner can take from the reports
Start with store sales over a comparable period. Then look at the revenue attributed to advertising and the full cost of reaching customers, including awareness spend. These are partial-month snapshots from one account. They do not establish how many sales would have happened without the advertising or what the business earned after product costs, fees and fulfilment.
See how we manage paid ads for Shopify brands. To discuss what your own figures show, book a free Growth Review.